Dashboards & Reports
How the business is doing, in numbers you can trust — and how to tell when a number is telling you something else.
A full tour of the main Dashboard.
MAT Smart Shop answers "how are we doing?" in two places. The Dashboard (left menu → MAIN → Dashboard, the first screen after sign-in) is the morning glance: today's money, this month's profit, who owes you, who you owe, and who to call. The Reports (left menu → REPORTS & DATA → Reports → All reports) are the careful look: a set of focused reports, each answering one question over any dates you choose, each compared with the period just before.
1. The Reports page, and how every report works
1.1 Finding the right report
Open REPORTS & DATA → Reports → All reports. Every report is a card, grouped by the question it answers — Sales, Profit, Money owed, Stock and Expenses — with one line saying what it tells you. Cards marked NEW were added in September 2026. The search box at the top finds a report by what you want to know: type debt, margin, reorder, cashier or VAT. The menu under Reports also links straight to the most-used reports.
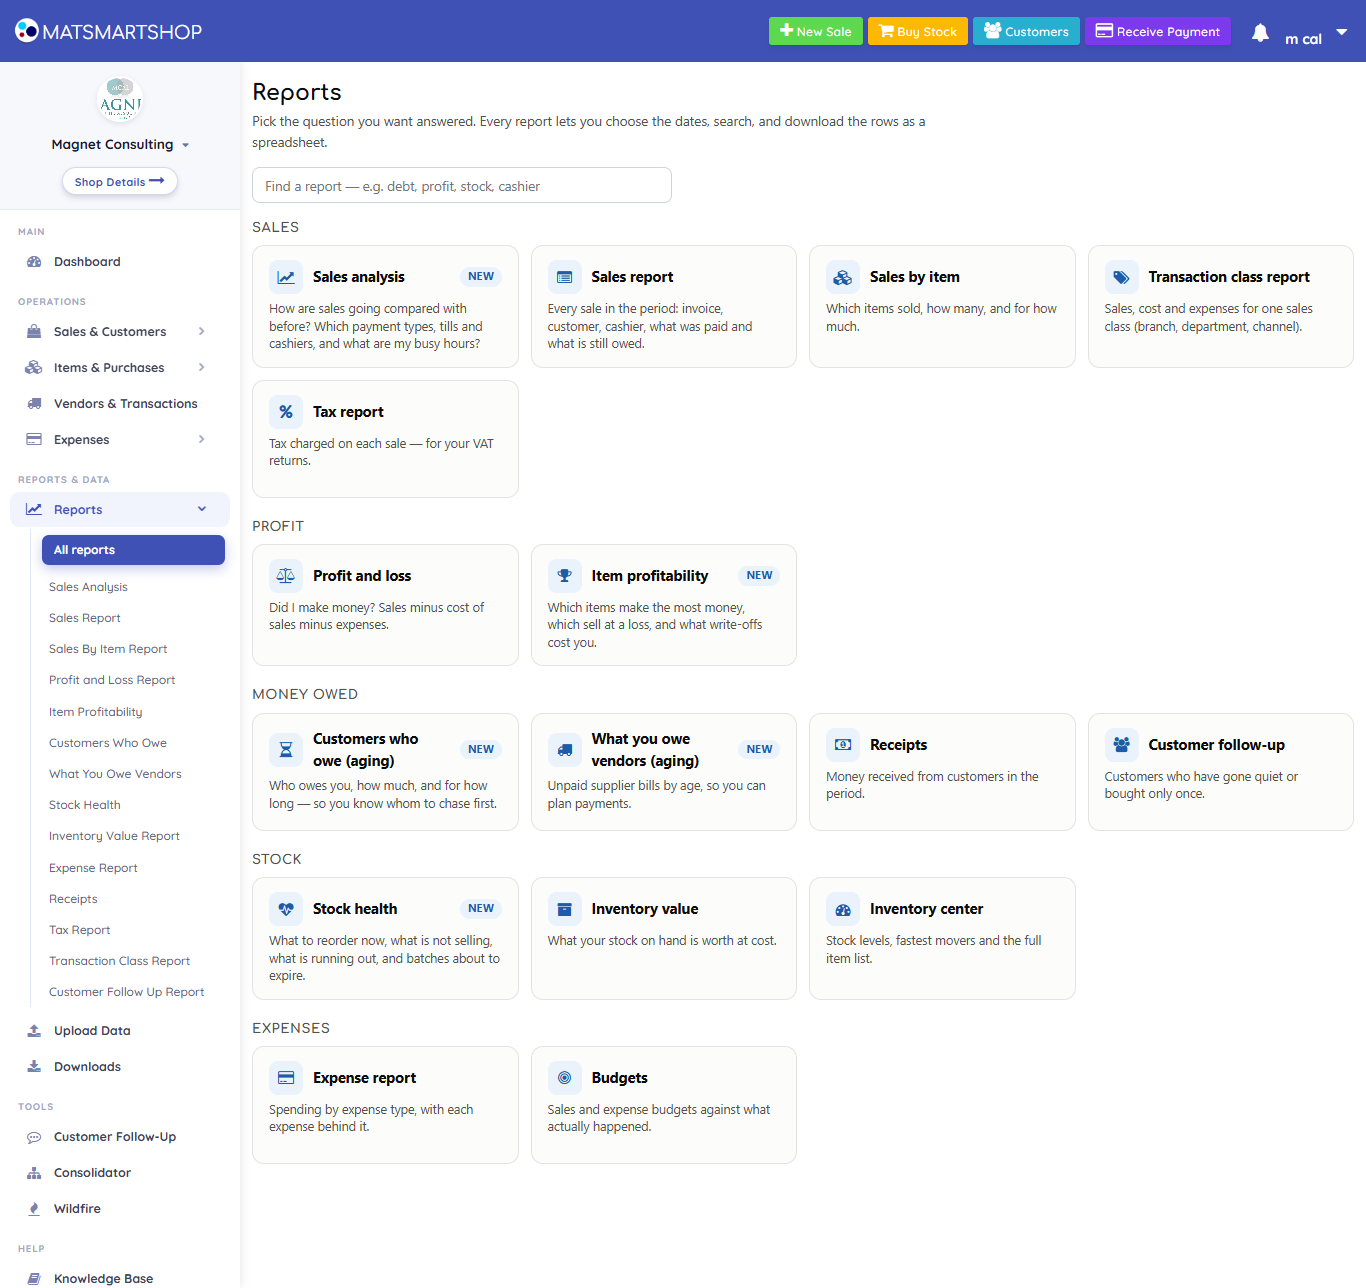
Every report page is laid out the same way, so learn it once:
- Title and one line saying what the report answers.
- Controls: the date range (or an "As of" date), then Export to Excel (CSV), Print, and on some reports Download PDF.
- Figure tiles — the headline numbers, most with a comparison to the previous period.
- Charts and breakdowns — where the numbers come from.
- The table — every row behind the figures, with filter buttons, search, sorting and totals.
- A grey note at the bottom saying exactly how the figures are worked out.
1.2 The date range
Click the date box to choose the period. The quick choices are Today, Yesterday, Last 7 days, Last 30 days, This month (1st to today), Last month, Last 90 days, This year and Last year; Custom Range lets you click a start and an end day on the calendars and press Apply. The box then reads, for example, This month: 1 Sep – 27 Sep 2026.
- Both days are included in full. A range ending "27 Sep" includes every sale made on 27 September — at the website, on the Android app and on the desktop tills.
- Each report remembers your last choice on that computer. Open the Tax Report on "Last month" once and it opens on "Last month" next time.
- The report refreshes as soon as you apply. Nothing needs saving.
Reports that describe a moment rather than a period — Customers Who Owe, What You Owe Vendors — have an As of date instead (today by default). Inventory Value and Stock Health always describe stock as it stands now.
1.3 The figure tiles and the change against the previous period
Most tiles compare the period with the same number of days immediately before it: this month so far against the same number of days before the 1st; "Last 7 days" against the 7 days before that; "Today" against yesterday. Under the figure you'll see, for example:
| You see | It means |
|---|---|
| ▲ +12% in green | Up 12%, and up is good for this figure (sales, profit). |
| ▲ +9% in red | Up 9%, and up is bad for this figure (costs, expenses, discounts, credit given). Red means "look at this", not "something is broken". |
| ▲ 3.5× | More than tripled — used instead of a percentage for big jumps. over 100× means the previous period was close to nothing. |
| New this period | Nothing to compare against — the previous period was zero. |
| No change | The same, or both periods were zero. |
The arrow and the word always travel together with the colour, so the tiles read correctly when printed in black and white.
1.4 Filter buttons, search, sort, totals
- Filter buttons above a table (for example All 64 · Unpaid 37 · Part paid 9 · Paid 18) show only one group; the number on each button is how many rows it holds.
- Search narrows the rows as you type, across every column — a customer, a phone number, an invoice number, a payment type.
- Click a column heading to sort; click again to reverse. The small arrow shows which way.
- Rows (bottom right) sets 10, 25, 50 or 100 rows per page; the ‹ › buttons page through. Your choice is remembered.
- The Total row at the bottom adds up every row that matches your filter and search, across all pages — search a customer's name and the total becomes that customer's total.
Wide tables scroll sideways inside their frame, so the rest of the page stays put on a phone.
1.5 Export, PDF and Print
- Export to Excel (CSV) downloads the report's rows for the selected dates as a .csv file (opens in Excel, Google Sheets or Numbers). It contains the full report for the period, not just the filtered rows on screen.
- Download PDF (Receipts, Inventory Value) builds a printable document of the rows currently listed — search or filter first to narrow it.
- Print prints just the report — the menu, buttons and filters are left out.
- Exports are a metered feature — each uses a small amount of your monthly usage allowance. If your allowance is used up, you'll be offered a top-up instead of the file. Viewing reports is not metered. See the Usage, Billing & Help guide.
1.6 If a report won't load
| Message | What to do |
|---|---|
| This report could not be loaded. Please try again. | Refresh the page. If it persists, tell support which report and which dates. |
| Your session has ended or you cannot view this store. | Sign out and in again. Staff need access to the store to see its reports. |
| No connection to the server. | Check the internet connection and try again. |
An empty report says so in words — "No sales in this period", "Nobody owes you anything as of this date" — so an empty table never means "something went wrong".
2. The Dashboard at a glance
The Dashboard is built top to bottom in order of urgency: money first, then profit, then the people and stock that need action.
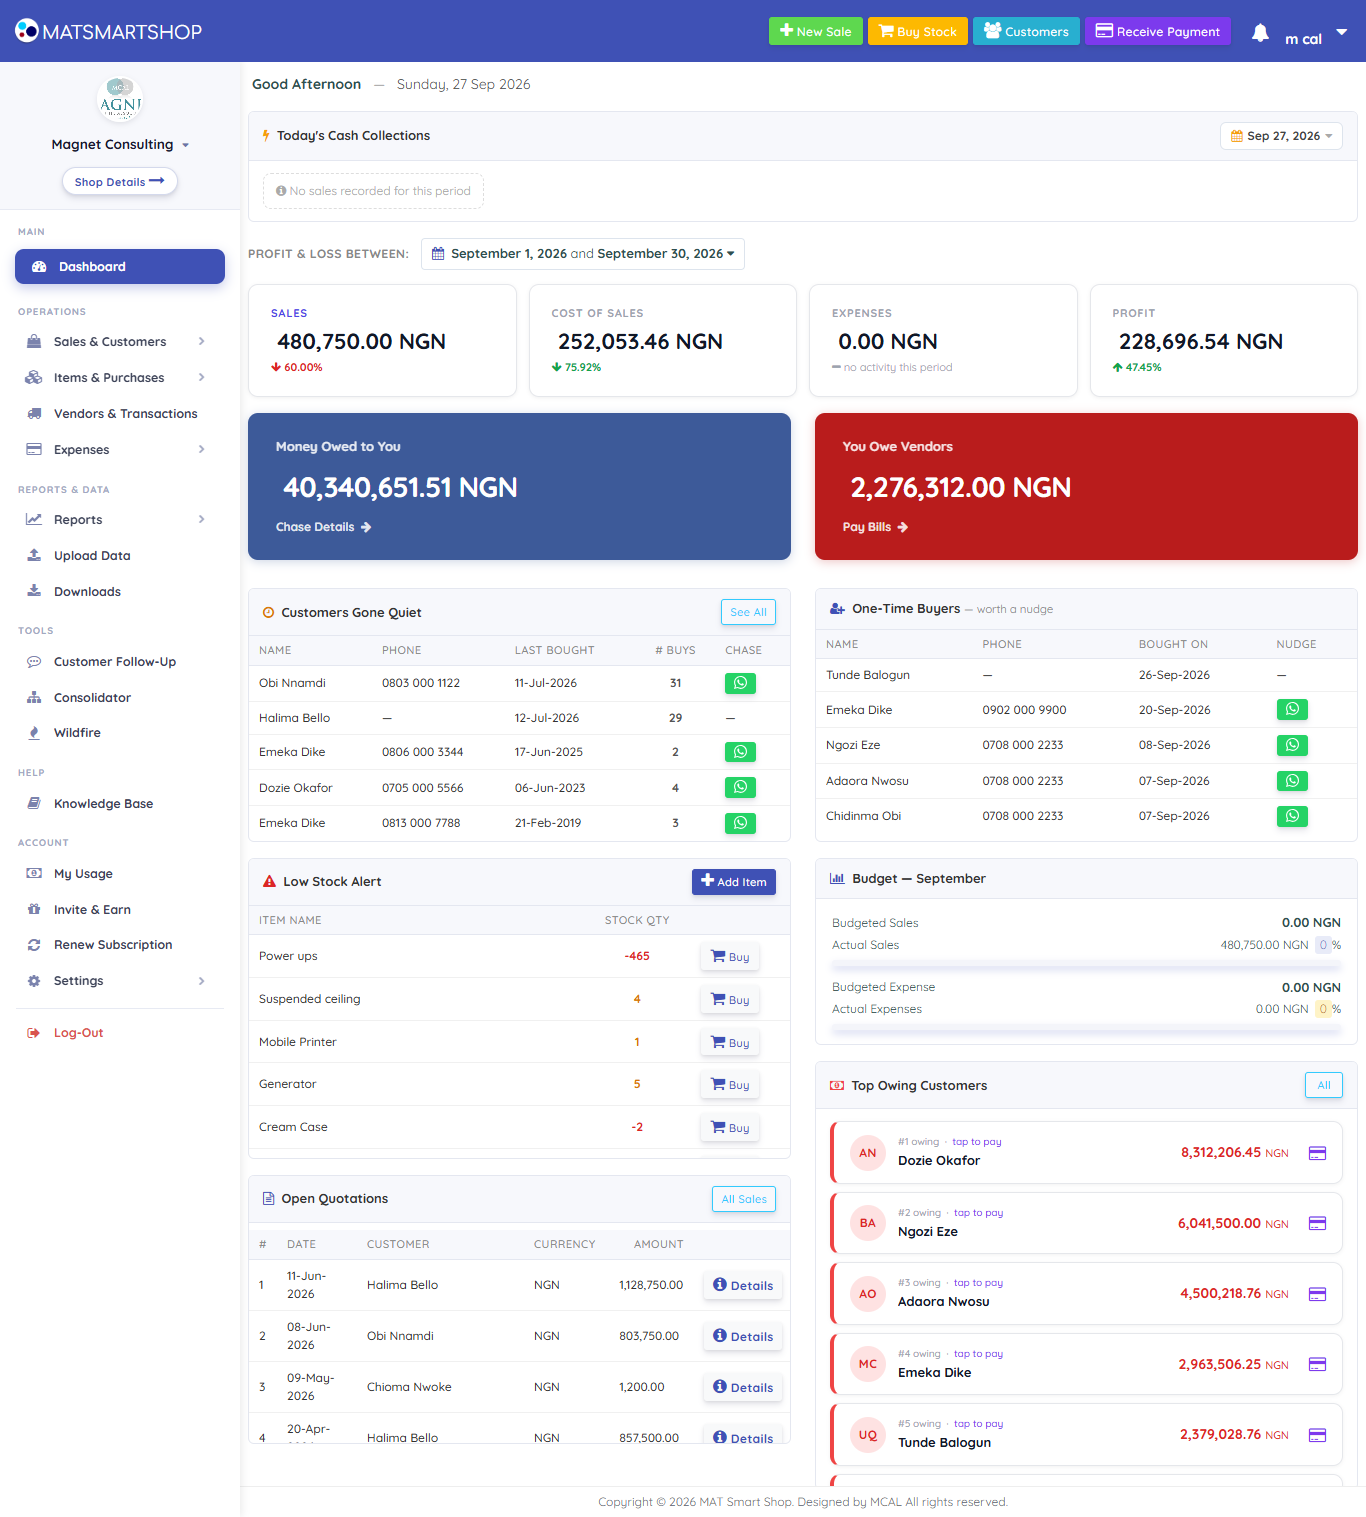
| Zone | What it shows | Section |
|---|---|---|
| Greeting strip | "Good morning/afternoon/evening" and the date. | — |
| Today's Cash Collections | Money received today, split by how it came in. | 3 |
| Profit & Loss Between | Sales, Cost of Sales, Expenses and Profit (or Loss) for this month, each with a trend. | 4 |
| Money Owed to You / You Owe Vendors | Total customer debt and total supplier debt, right now. | 5 |
| Action panels | Customers to chase, one-time buyers to nudge, stock to reorder, quotations to close, budget progress, biggest debtors, anniversaries. | 6 |
| Automatic messages | Your automatic texts (thank-you after a purchase, payment notes, date messages) with an on/off switch each. | 6.8 |
Staff see the Dashboard only if they have the Dashboard permission (User List → Edit); without it they start on New Sale. Its Profit & Loss figures open for anyone with the Dashboard. The first time an owner signs in, a welcome pop-up may appear over it; a weekly "invite a shop" reminder can also appear. Close either to reach the Dashboard.
3. Today's Cash Collections
The top card answers the question every shop owner asks at closing time: how much money came in today, and where is it?
- One pill per payment type — Cash, POS, Transfer to GTBank, and so on — showing the amount and the number of transactions (e.g. ₦84,500 · 12 txns).
- A Total pill appears when money came in more than one way.
- The date button at the top right lets you look at another day, or a run of days (the total pill then reads Grand Total).
If nothing came in, the card says No sales recorded for this period.
4. Profit & Loss cards and the trend arrows
Four cards under PROFIT & LOSS BETWEEN, opening on the current month. Click the date box beside the heading to change the period.
| Card | What it adds up |
|---|---|
| Sales | Every saved sale in the period, after discounts and before tax — cash and credit alike. Quotations (held sales) are excluded. |
| Cost of Sales | What the goods you sold cost you, at their average cost when they were sold, plus stock written off in adjustments. Services have no cost. |
| Expenses | Every expense dated in the period (see the Expenses, Vendors & Budgets guide). |
| Profit / Loss | Sales − Cost of Sales − Expenses. The card turns red and relabels itself Loss when the result is negative. |
4.1 The trend line under each figure
Each card compares the period with the same number of days immediately before it — this month so far against the equal stretch before the 1st; "Last 7 Days" against the 7 days before that; Today against yesterday.
- The arrow shows direction: up or down.
- The colour shows whether that is good for you. Sales and profit going up are green; Cost of Sales and Expenses going up are red. So a red up-arrow on Expenses means you spent more — not that something is broken.
- "new this period" or "no activity this period" appears when there was nothing to compare against.
For the same figures as a statement, month by month, with margins and the split of expenses, open Reports → Profit and Loss (section 11) — for the same dates it always shows the same numbers as these cards.
5. Money Owed to You / You Owe Vendors
| Tile | Meaning | Link |
|---|---|---|
| Money Owed to You (blue) | The total of every customer's outstanding balance — all unpaid and part-paid invoices, less payments. This is not date-filtered: it is everything owed today. | Chase Details → Customer Center, where each debtor can be opened. |
| You Owe Vendors (red) | The total of every supplier's balance — unpaid bills and purchases, less payments. | Pay Bills → Vendors & Transactions. |
The P&L dates above these tiles have no effect on them. To see how long each balance has been owed, open Customers Who Owe (section 13) or What You Owe Vendors (section 14) — their totals are the same as these tiles.
6. The action panels
Below the headline figures, each panel is a short to-do list. None of them is date-filtered by the P&L box.
6.1 Customers Gone Quiet
Up to five regular customers who are overdue for a visit by their own standards. For each named customer with at least two purchases, the system measures the gap between their last two visits — their usual buying cycle — and flags them when the time since their last visit is longer than that.
- Sorted by how overdue they are relative to their habit, most overdue first.
- The badge turns amber at 1.5× their usual gap and red at 2×. A customer who normally buys every 10 days and hasn't been in for 25 is red.
- Chase opens WhatsApp with the customer's number. See All opens the Customer Follow Up Report. To message all of them at once by SMS, use TOOLS → Customer Follow-Up → Gone Quiet.
- Sales to Cash (the walk-in customer) are ignored.
6.2 One-Time Buyers — worth a nudge
Up to five named customers who have bought exactly once. A second purchase is the hardest one to win; a friendly message is cheap. Nudge opens WhatsApp. For all of them at once, use Customer Follow-Up → Bought Once.
6.3 Low Stock Alert
Up to seven items at or below their reorder level, with the quantity coloured red at zero or below and amber at five or fewer. Click an item to open its detail. Add Item goes to the Item List. An item whose reorder level is 0 never appears here — set reorder levels in the Item List. For the full list with how much to order, open Stock Health (section 17).
6.4 Open Quotations
The five most recent quotations (sales saved as quotations rather than completed). Each is a sale you haven't closed yet — follow up, then convert it from the Sales & Quotation List. All Sales opens that list.
6.5 Budget — this month
Shown when you've set a budget covering the current month (SETTINGS → Budgets):
| Line | Bar colour |
|---|---|
| Budgeted Sales vs Actual Sales, with % of target reached | Red below 50%, yellow 50–70%, green above 70%. |
| Budgeted Expense vs Actual Expenses (all expense budgets for the month combined), with % used | Green below 40%, yellow 40–70%, red above 70%. |
Early in the month a sales bar is naturally red — 30% of target by the 9th is on track. Read it against how far through the month you are.
6.6 Top Owing Customers
The six customers with the largest outstanding balances, biggest first. Click a name for their recent invoices, or use Receive Payment straight from here:
- The Receive Payment from customer dialog shows their Outstanding Balance.
- Choose the Date and Payment Type, type the Amount. New Outstanding Balance updates as you type.
- Save, or Save & Receipt to save and open a receipt you can print, download or send by WhatsApp.
All opens Customer Center.
6.7 Anniversaries
Appears only when one or more customers have a birthday or anniversary coming up, with a WhatsApp button for each. For automatic birthday SMS, see the Customer Follow-Up guide.
6.8 Automatic messages
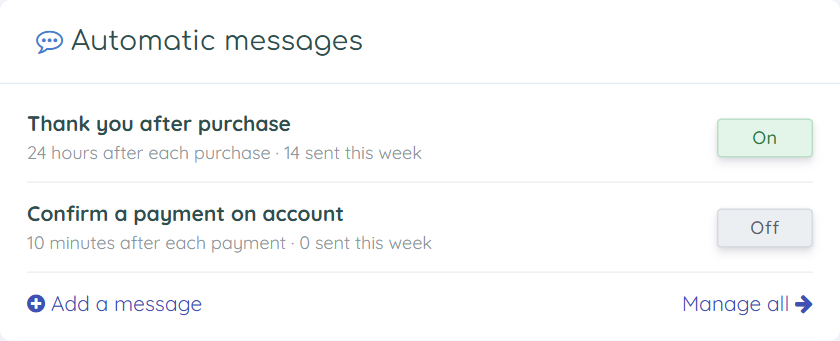
Lists your automatic messages (up to five), each with when it goes, how many went out this week and an On/Off switch. Switching On shows the SMS-unit cost and asks first; switching Off warns that anything waiting to go out is cancelled. While you have no purchase thank-you, the card offers Thank customers automatically — Turn on…. Add a message opens the message form here; Manage all opens Sales & Customers → Automatic Messages. On the new dashboard you can hide or move the card with Customise. Staff without the customers permission don't see it. Full details: Customer Follow-Up guide, section 12.
7. Sales Analysis
Reports → Sales Analysis is the report to open first. It answers: are sales going up or down, where do they come from, who is selling, and when are we busiest? It opens on the last 30 days.
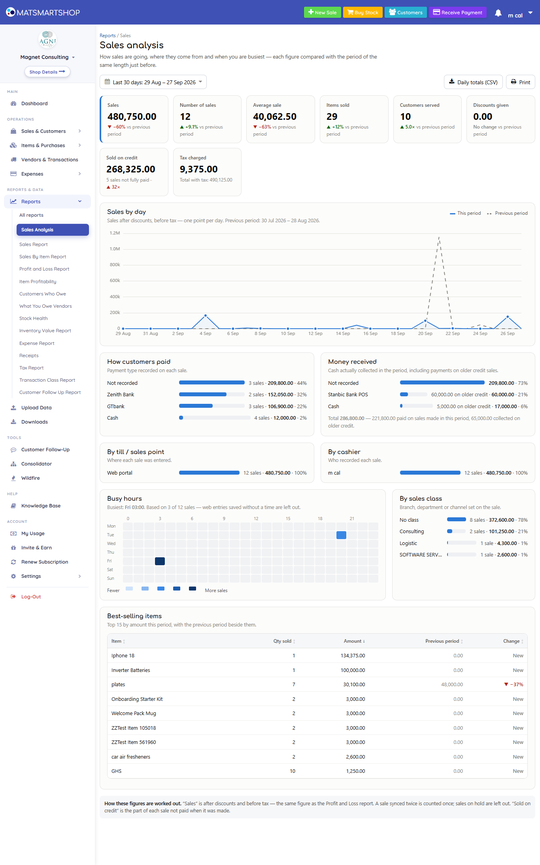
7.1 The figure tiles
| Tile | Meaning |
|---|---|
| Sales | After discounts, before tax — the same figure as the P&L. |
| Number of sales | Invoices in the period. |
| Average sale | Sales ÷ number of sales — the size of a typical basket. |
| Items sold | Units across all invoices. |
| Customers served | Different named customers who bought. The walk-in Cash customer is not counted. |
| Discounts given | Invoice discounts. Up is shown in red. |
| Sold on credit | The part of each sale not paid at the moment of sale, and how many sales were not fully paid. Up is shown in red. |
| Tax charged | Tax on the period's sales, with the total including tax underneath. |
7.2 Sales by day
A line of sales per day (per week for ranges over two months, per 30 days for ranges over a year), with the previous period as a dashed grey line laid over it day for day — so "Monday this week" sits above "Monday last week". Hover a point for the exact figures.
7.3 Where the sales come from
| Card | What it shows |
|---|---|
| How customers paid | Sales by payment type recorded on the sale — amount, number of sales and share. |
| Money received | Money actually collected in the period by payment type, split into paid on sales made in this period and collected on older credit. This is the Receipts report in one card. |
| By till / sales point | Web portal, Android app, or the name of each desktop till. |
| By cashier | Who recorded each sale. Not recorded means the sale carries no user; User … means a phone user the website doesn't know by name yet. |
| By sales class | Branch, department or channel tagged on the sale (No class for the rest). |
More than eight rows are folded into Other.
7.4 Busy hours
A grid of weekdays against hours of the day: the darker the square, the more sales. The line above it names the busiest hour ("Busiest: Sat 12:00"). Use it to plan staff and opening hours.
7.5 Best-selling items
The top 15 items by amount, with quantity, the previous period's amount beside it and the change — a quick way to see a product take off or fade. For every item, use Sales By Item (section 9).
Daily totals (CSV) exports one row per day of the period.
8. Sales Report
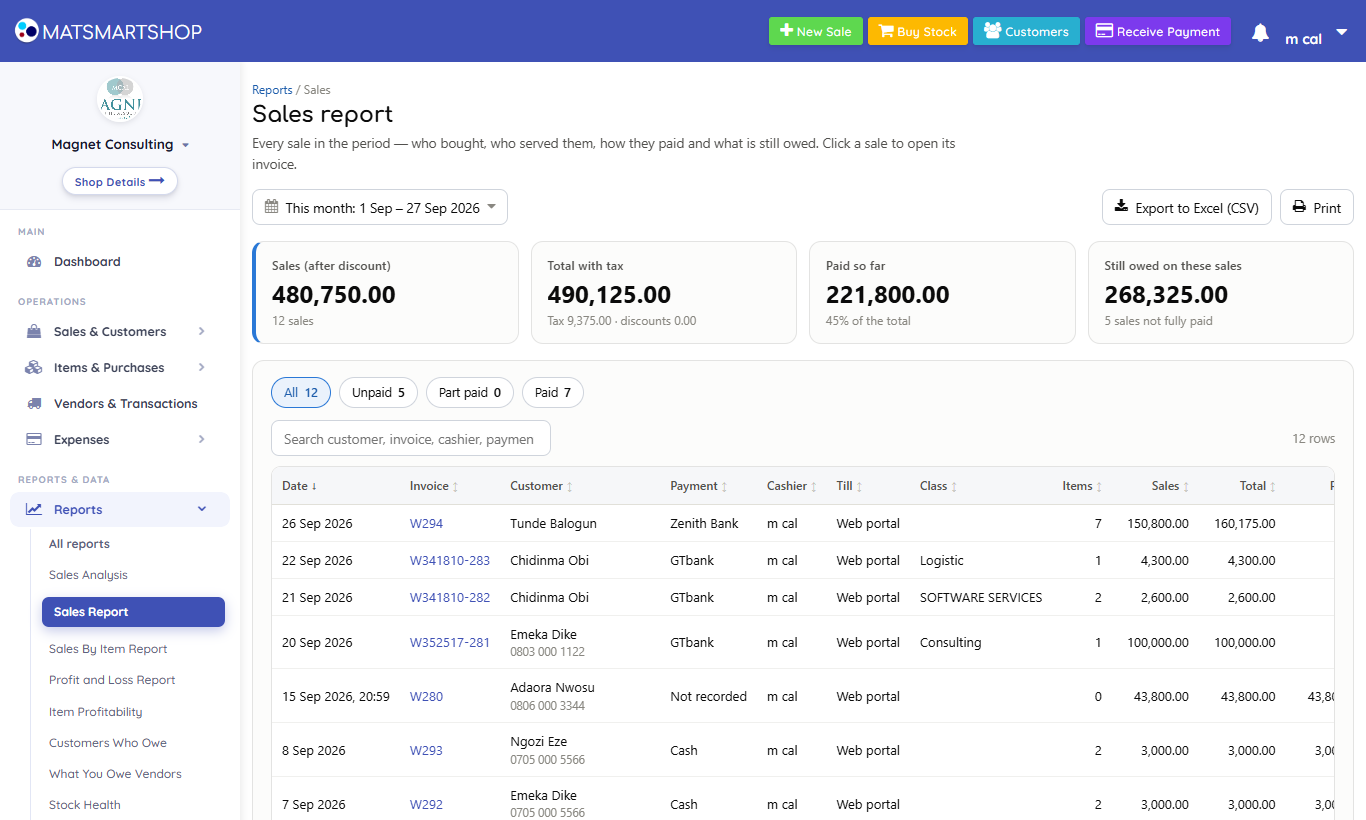
Reports → Sales Report lists every sale in the period, one row per invoice, with who bought, who served them, how they paid and what is still owed.
| Tile | Meaning |
|---|---|
| Sales (after discount) | The same figure as P&L Sales for the same dates, and the number of sales. |
| Total with tax | What customers were charged, with the tax and discounts in it. |
| Paid so far | How much of those invoices has been paid — including payments received later — and what share of the total that is. |
| Still owed on these sales | What remains unpaid on the period's invoices, and how many are not fully paid. |
| Column | Meaning |
|---|---|
| Date | Date, and the time for sales made on the app or a till. |
| Invoice | The invoice number. Click it to open the invoice. |
| Customer | Name, with phone number underneath. |
| Payment / Cashier / Till | Payment type on the sale; who recorded it; where (Web portal, Android app or a till's name). |
| Class | Shown only if any sale in the period has a sales class. |
| Items | Units on the invoice. |
| Sales / Total | After discount before tax / what the customer was charged. |
| Paid / Owed | Paid to date (at the sale and afterwards) / still outstanding. |
| Status | Paid, Part paid or Unpaid, each with its own icon. |
- The buttons All · Unpaid · Part paid · Paid show one group. Unpaid for "This month" is a ready-made chase list.
- Quotations (held sales) and deleted sales are not listed. A sale that a phone sent twice while syncing is listed once.
For the goods on a single invoice, click its number. For totals by product, use Sales By Item.
9. Sales By Item
Reports → Sales By Item turns the same sales inside out: one row per product, with how many you sold, what it earned, and how that compares with the previous period.
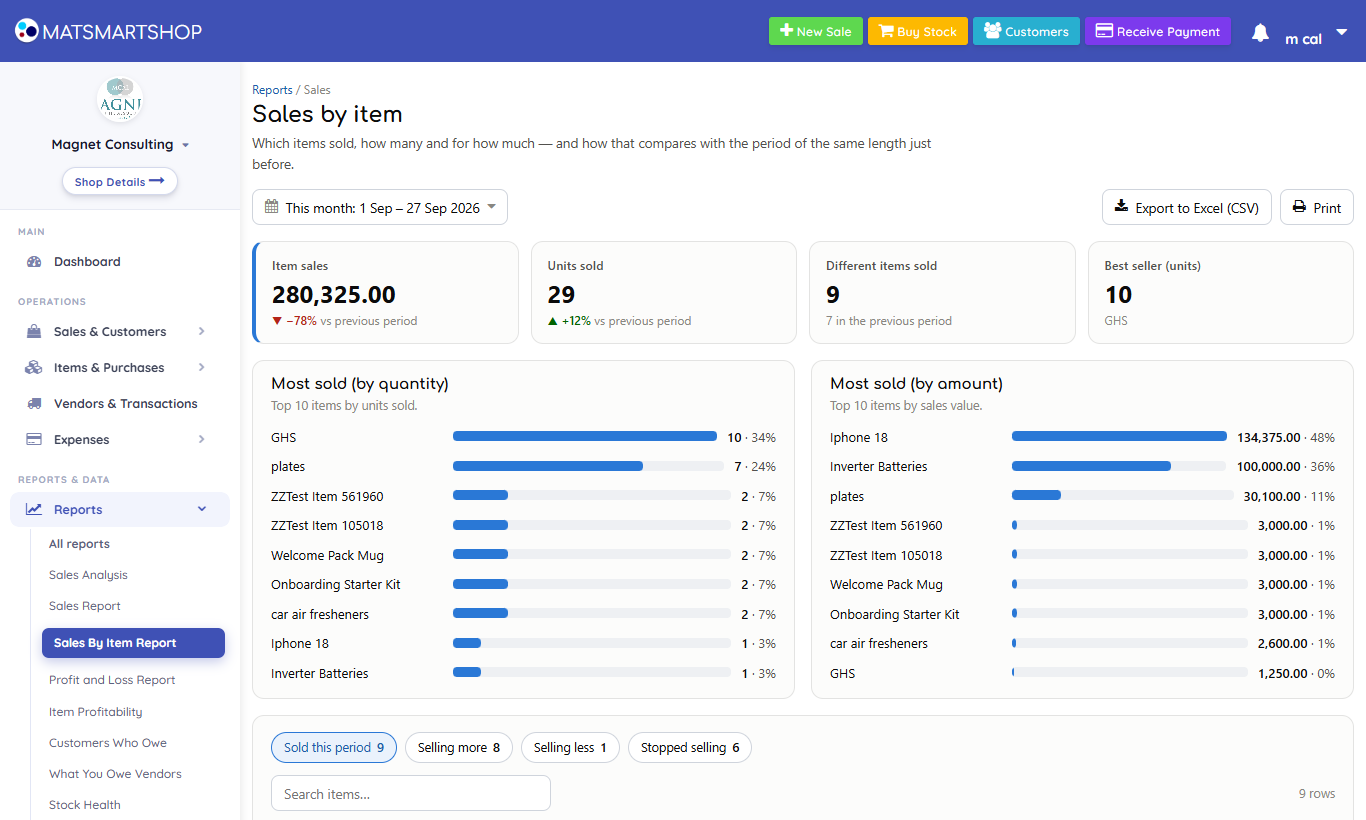
- Tiles: Item sales, Units sold (both compared with the previous period), Different items sold, and the Best seller by units.
- Most sold (by quantity) and Most sold (by amount) — the top ten each way. They are rarely the same list: cheap fast movers top the first, expensive items the second.
- Buttons: Sold this period, Selling more, Selling less, and Stopped selling — items that sold last period and not at all this period. Check those aren't simply out of stock.
| Column | Meaning |
|---|---|
| Qty sold / Previous / Change | Units this period, units in the previous period, and the change (New if it didn't sell before). |
| Avg price | Sales ÷ units — watch it if you give a lot of line discounts. |
| Sales / Share | What those units sold for, and that item's share of all item sales. |
| Cost / Profit / Margin | What those units cost you when they were sold — the same cost the P&L uses — and what's left. |
Item sales come from the invoice lines. A discount taken off the whole invoice isn't shared out over its items, so the item totals can be a little higher than P&L Sales. Item Profitability (section 10) shows the difference.
10. Item Profitability
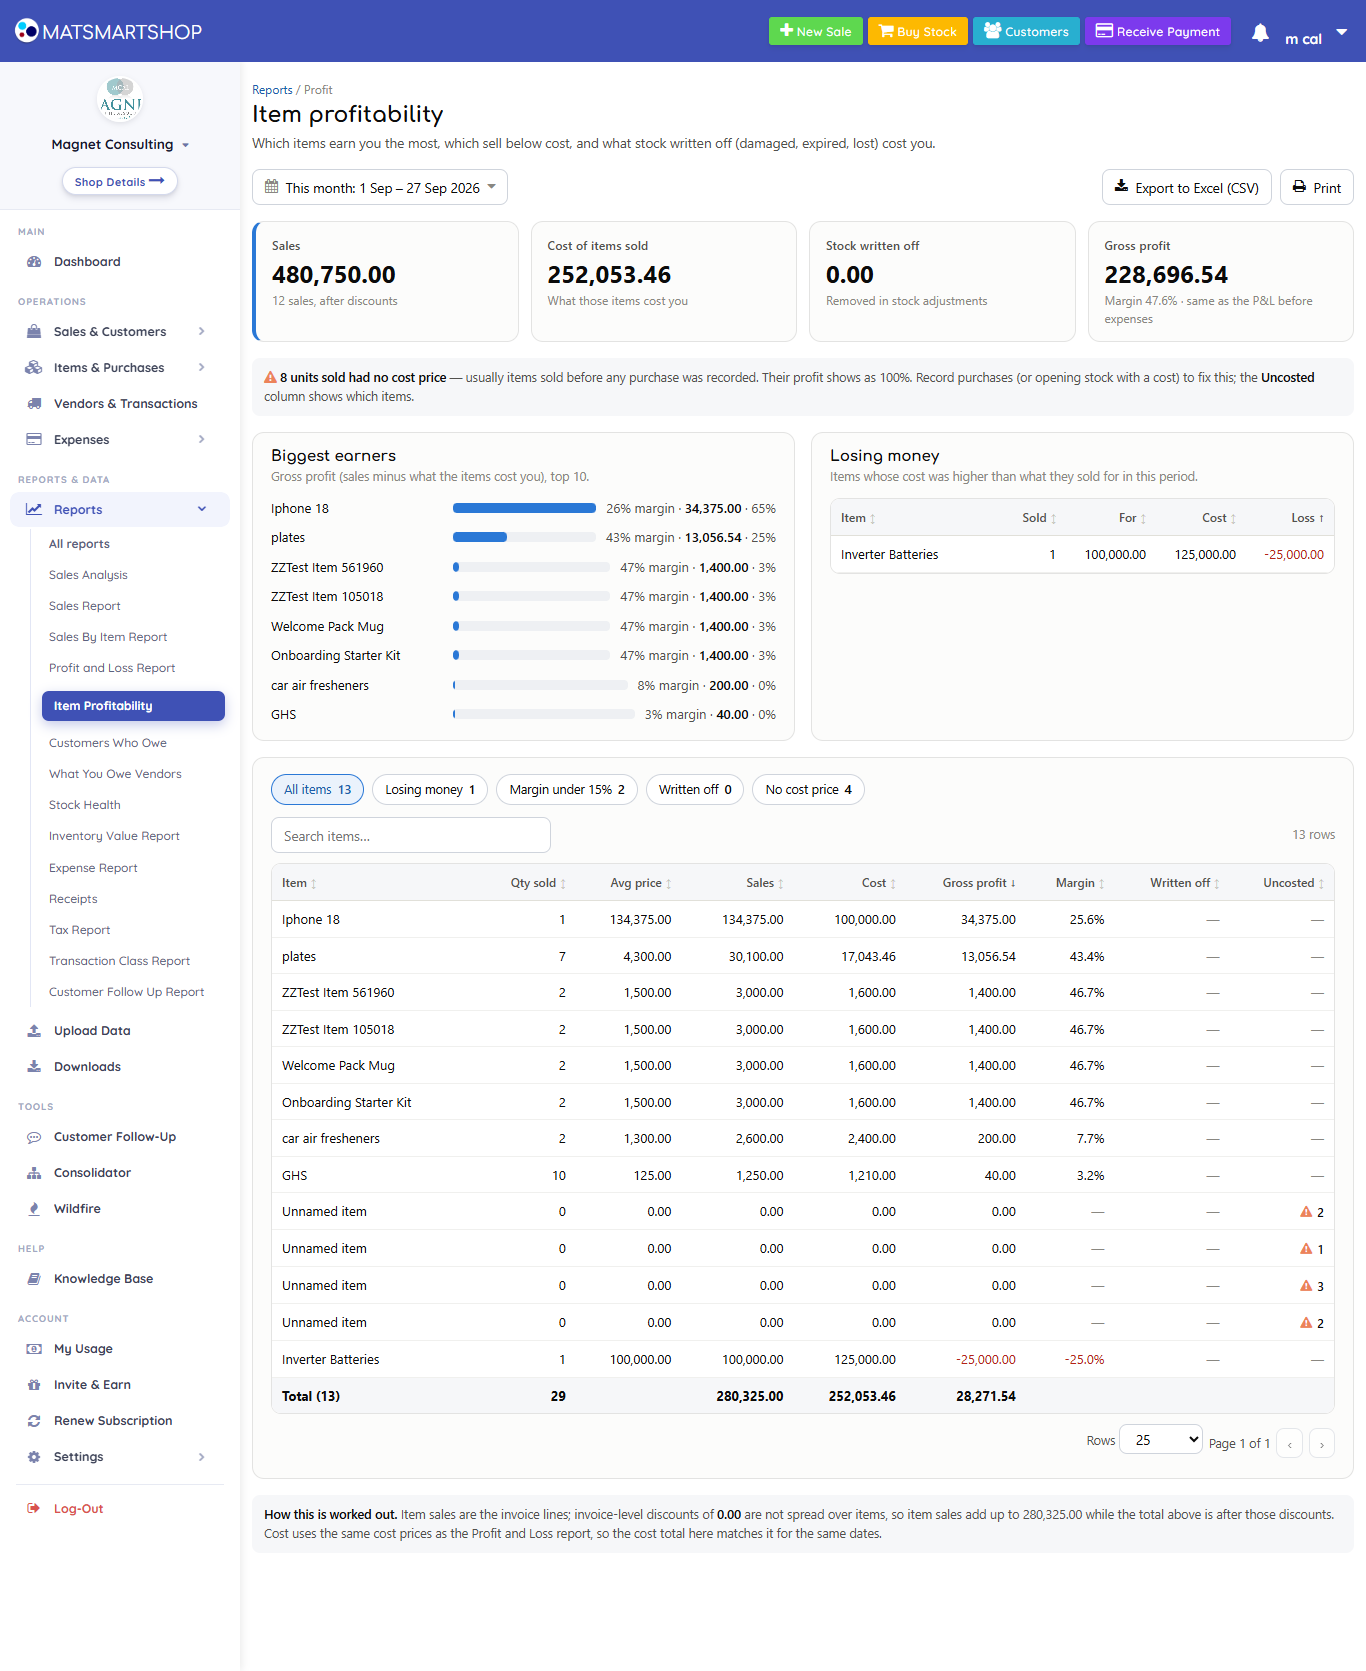
Reports → Item Profitability answers: which items make the money, which lose it, and what did stock written off cost me?
| Tile | Meaning |
|---|---|
| Sales | After discounts — P&L Sales. |
| Cost of items sold | What the goods sold cost you, each at its cost when sold. |
| Stock written off | The cost of stock removed in adjustments (damaged, expired, lost). |
| Gross profit | Sales − cost of items sold − stock written off, with the margin. Exactly the P&L before expenses. |
- Biggest earners — the ten items bringing in the most profit, with their margin.
- Losing money — items whose cost was higher than what they sold for. Reprice them, check their purchase cost was keyed correctly, or stop stocking them.
- Buttons: All items, Losing money, Margin under 15%, Written off, No cost price.
11. Profit and Loss
Reports → Profit and Loss is the dashboard's four P&L cards as a full statement, for any period, with the previous period beside it.
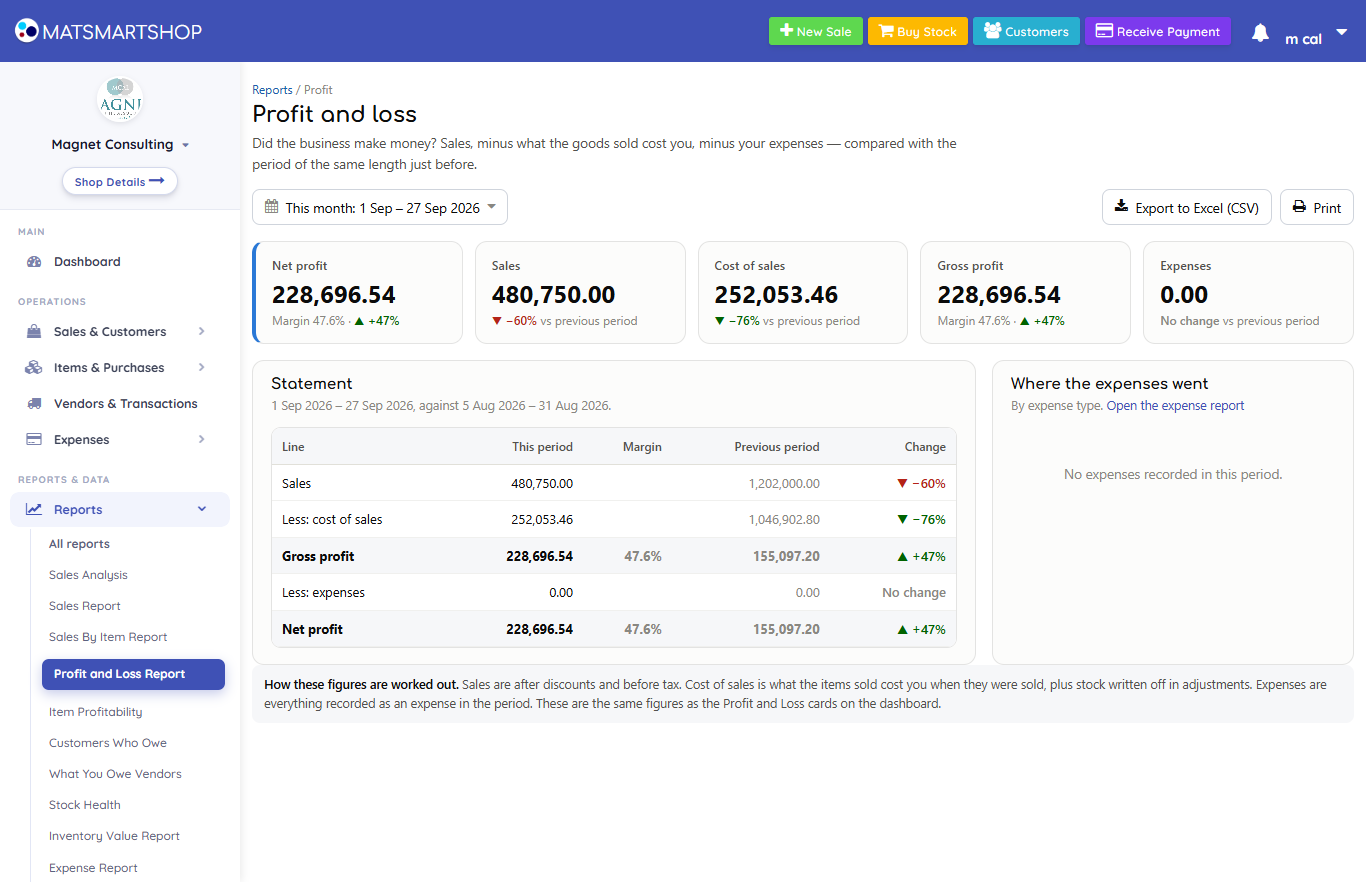
- Tiles: Net profit (or Net loss) with its margin, Sales, Cost of sales, Gross profit and Expenses, each against the previous period.
- Statement: Sales, less cost of sales, Gross profit and its margin, less expenses, Net profit and its margin — with the previous period and the change on every line.
- Where the expenses went: the period's expenses by type. No expense type is anything recorded without one.
- Month by month (when your dates span two months or more): a bar per month — blue for profit, red for loss — and a table of each month's sales, cost, gross profit, expenses and net profit. Part months at either end are cut to your dates. Choose This year to see the year so far at a glance.
It uses exactly the same rules as the Dashboard cards (section 4): for the same dates the two always agree. Export to Excel gives one row per month plus a total row.
| Sales | 4,850,000.00 | |
| Less: cost of sales | 3,212,500.00 | |
| Gross profit | 1,637,500.00 | 33.8% |
| Less: expenses | 905,000.00 | |
| Net profit | 732,500.00 | 15.1% |
12. Transaction Class Report
If your store groups sales and expenses into Transaction Classes — branches, departments or lines of business (set up under SETTINGS → Transaction Class) — this report gives a profit and loss for one class at a time.
- Choose the class in Class. General Class (sales with no class) is everything not tagged with a class. The report remembers your last class.
- Set the date range.
- Tiles: Profit (or Loss), Sales, Cost of sales (share) and Expenses for the class, each against the previous period; the Statement sets them out with margins.
- Sales by class, beside the statement, compares every class in the period.
- Sales and Expenses are those tagged with the class. Cost of Sales is shared out: the store's total cost of sales multiplied by this class's share of total sales (items are not tagged with a class). A class with 40% of sales carries 40% of cost.
13. Customers Who Owe (aging)
Reports → Customers Who Owe answers: who owes me, how much, and for how long? — so you know whom to chase first. It describes balances as of a date (today unless you choose another).
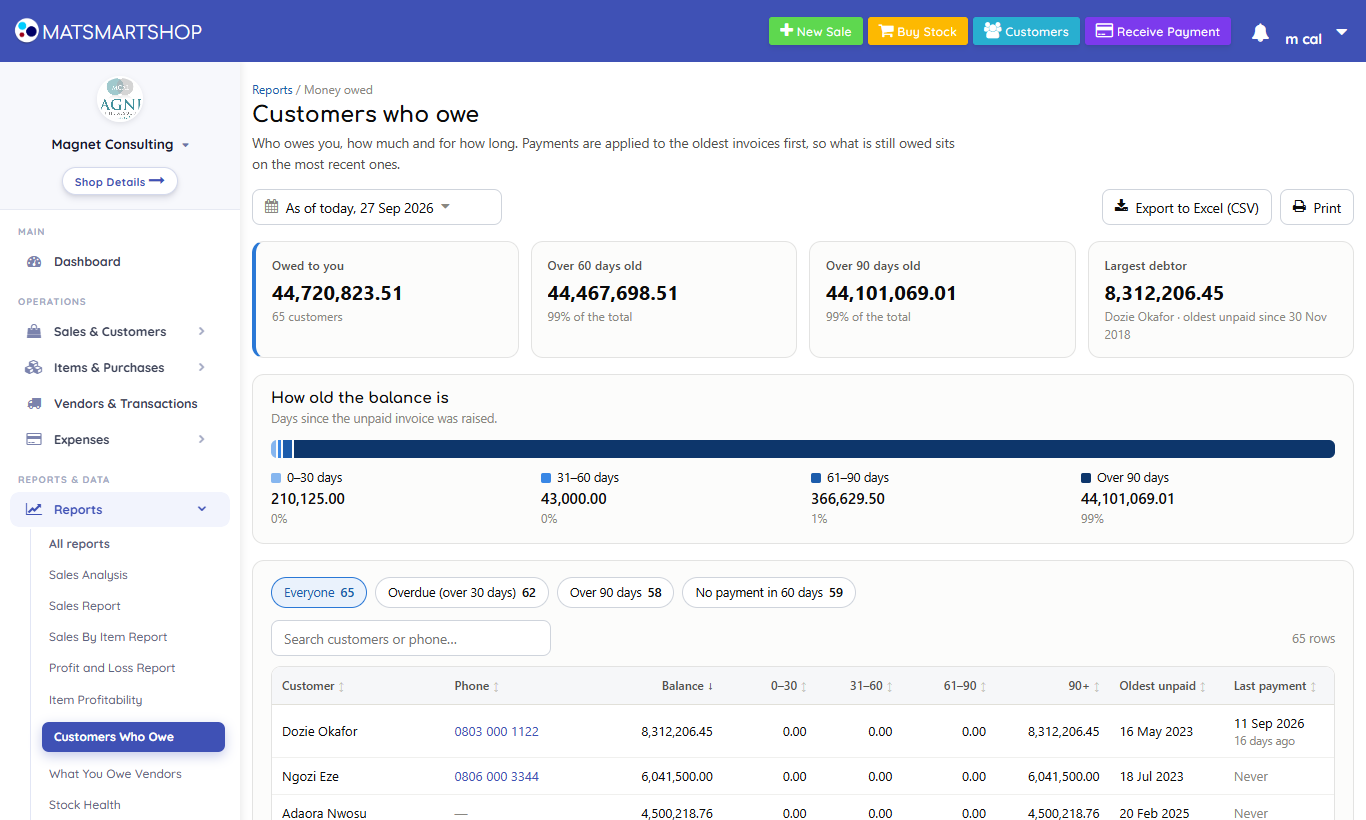
- Tiles: Owed to you and by how many customers; Over 60 days old; Over 90 days old; the Largest debtor and how long ago their oldest unpaid invoice was raised.
- How old the balance is — a strip split into 0–30, 31–60, 61–90 and Over 90 days, darker for older, with the amount and share of each.
- Buttons: Everyone, Overdue (over 30 days), Over 90 days, No payment in 60 days.
- Columns: customer, phone (tap it to call on a phone), Balance, the four age columns, Oldest unpaid invoice date, and Last payment with "n days ago" (or Never).
- Customers in credit, below, lists anyone who has paid more than they were billed — money you are holding for them.
The total is the same as the Dashboard's Money Owed to You. The walk-in Cash customer is left out.
A balance brought in — what a customer owed before you started SmartShop (Sales & Customers guide, 8.2) — is counted here as their oldest debt, dated on the day you gave it, and payments clear it first. A balance brought in that you owed a customer shows under Customers in credit.
14. What You Owe Vendors (aging)
Reports → What You Owe Vendors is the same report for suppliers: unpaid bills and purchases by age, as of a date, so you can plan payments and see who you've kept waiting longest. Payments clear the oldest bills first. The total equals the Dashboard's You Owe Vendors; the Cash vendor is left out; (No vendor recorded) collects bills and expenses saved without a vendor. Vendors in credit lists suppliers you have paid ahead.
15. Receipts
Reports → Receipts lists every payment received from customers in the period — at the till and on credit accounts.
- Tiles: Money received and the number of receipts, Customers who paid, Average receipt and the Largest receipt.
- By receiving account — the payment type the money came in on. Use it to reconcile with the cash drawer and your bank app.
- Top payers — the customers who paid most in the period.
- The table: Date, Customer, Receiving account, Amount, and a View button.
View opens that receipt, ready to Print, Export PDF or send by WhatsApp. Download all PDF builds one document of every receipt currently listed — search first to narrow it, for example to one customer or one payment type.
From a customer's page (Customers → the customer → receipts), the report opens locked to that customer — the title carries their name, it starts on This year, and Back to customers returns you.
This is money in: it includes payments on old invoices and leaves out credit sales not yet paid. It is the list behind the Dashboard's Cash Collections. A receipt that a phone sent twice while syncing is listed once.
16. Tax Report
Reports → Tax Report gives the figures for a VAT return. It opens on last month.
- Tiles: Tax charged (and how many sales carried tax), Sales before tax (with the taxable part), Sales including tax, and the Average tax rate on taxed sales.
- By month — one row per calendar month in the period: number of sales, sales before tax, taxable sales, tax charged, and sales including tax. For a quarterly return, choose the quarter as a Custom Range and read the three rows.
- Buttons: Sales with tax (the default), Sales without tax, All sales. The table shows each sale's invoice (click to open), customer, sales before tax, tax, the rate and the total.
Whether tax is charged at all is set in your store profile (see the Store Setup, Users & Security guide). A new rate applies to sales made after you save it.
17. Stock Health
Reports → Stock Health answers: what should I reorder now, what isn't selling, what am I about to run out of, and what is about to expire? It works from how fast each item has sold recently. Choose the window in Speed of sale over the last — 14, 30, 60, 90 or 180 days (30 by default; remembered).
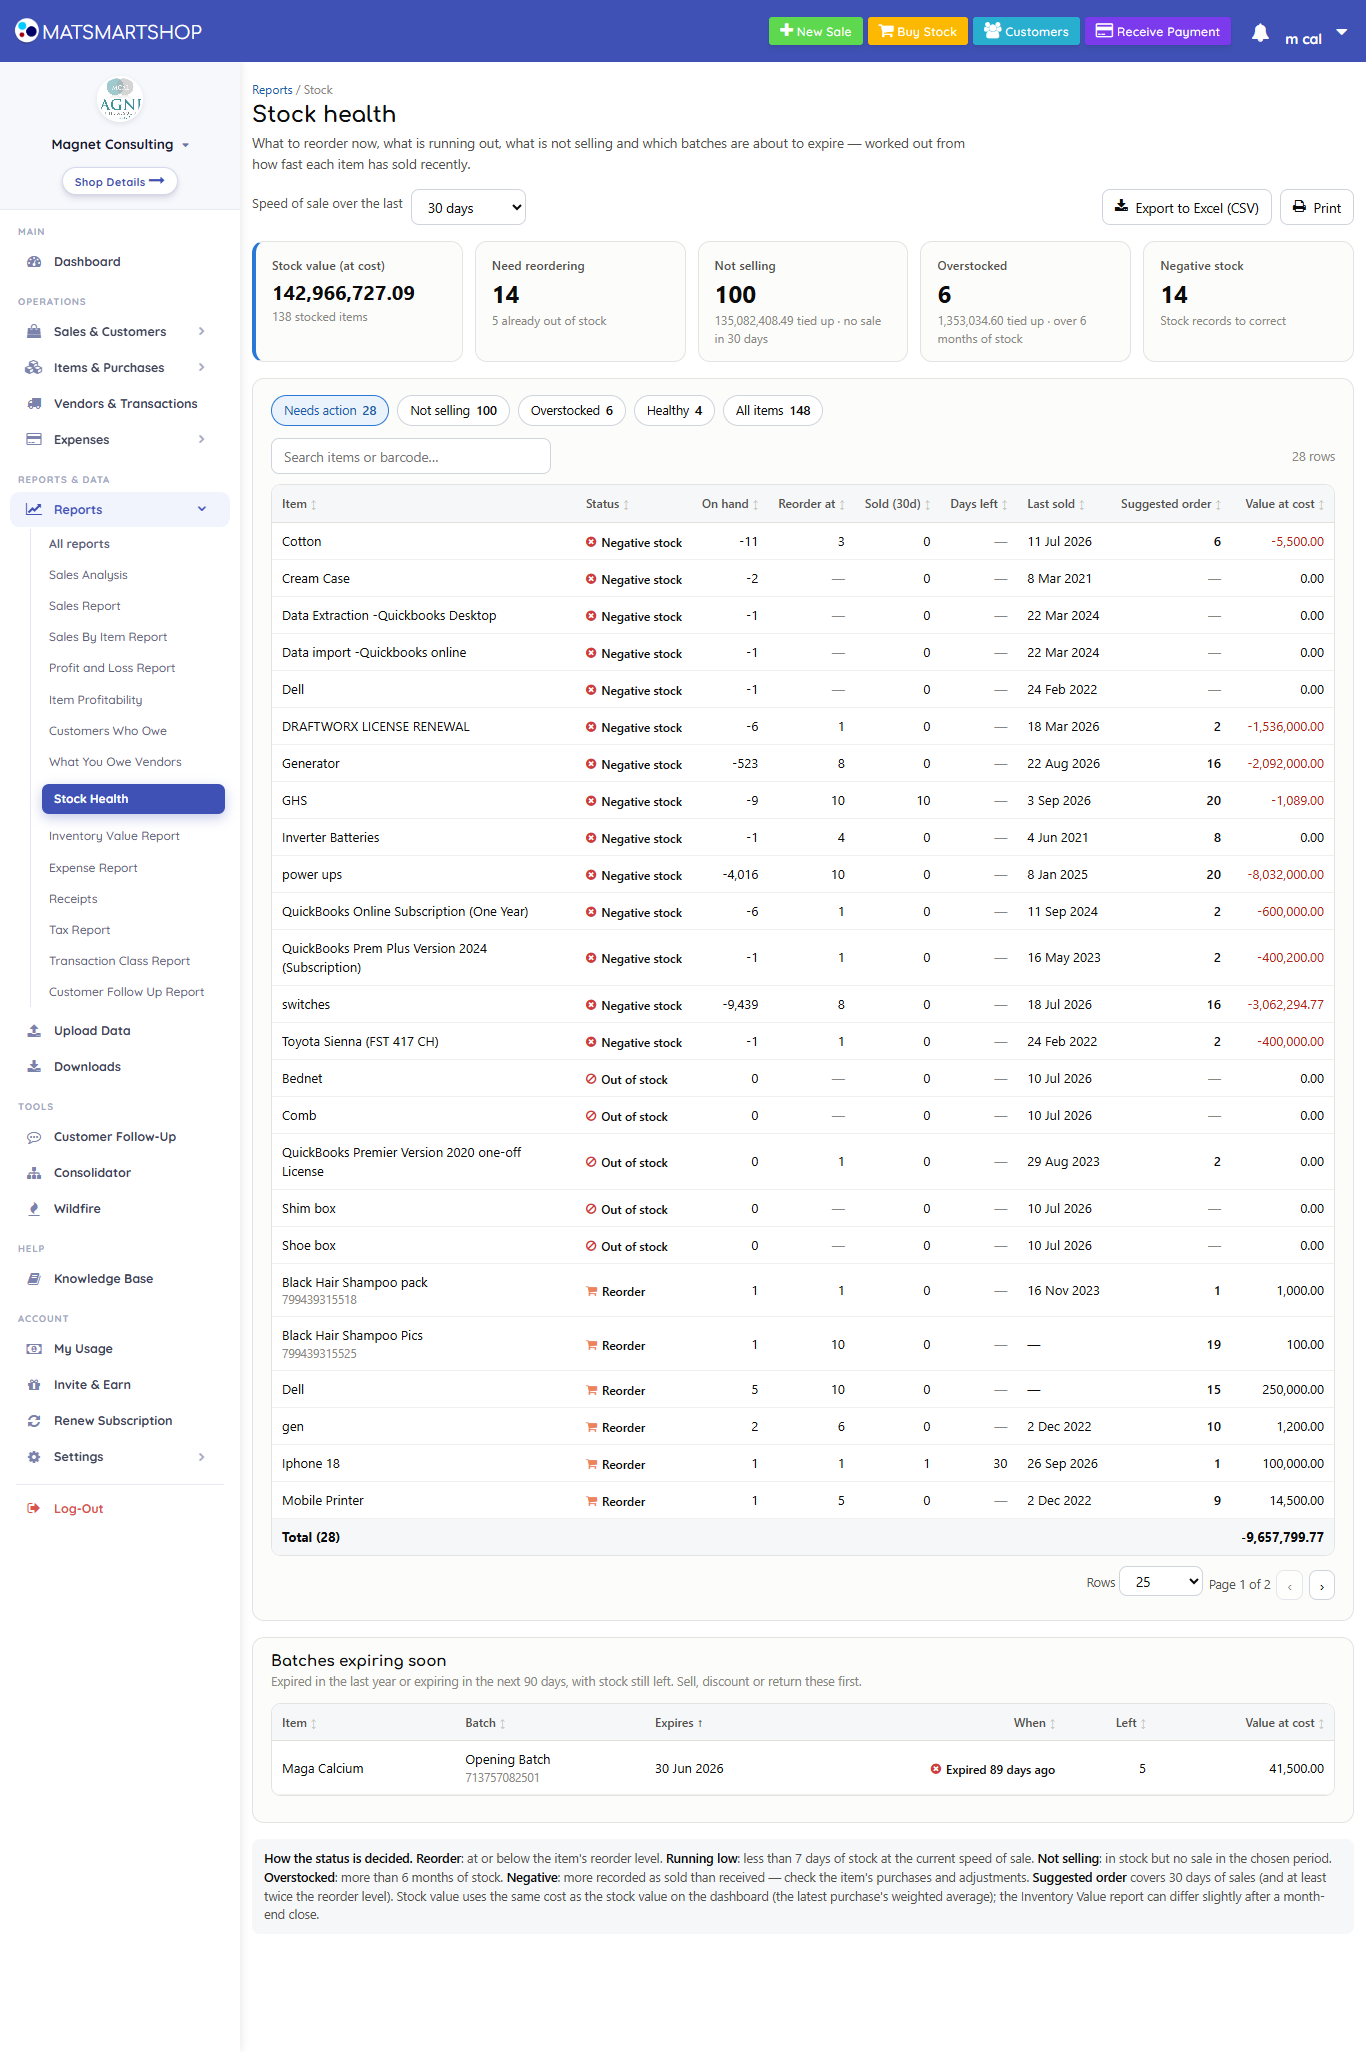
- Tiles: Stock value (at cost); Need reordering (and how many are already out); Not selling and the money tied up in them; Overstocked and the money tied up; Negative stock.
- Buttons: Needs action (negative, out, reorder, running low — the default), Not selling, Overstocked, Healthy, All items.
| Status | Means | Do |
|---|---|---|
| Negative stock | More recorded as sold than was ever received. | Check the item's purchases and adjustments — a purchase is missing. |
| Out of stock | Nothing on hand. | Reorder if it sells. |
| Reorder | At or below the reorder level you set. | Order the suggested quantity. |
| Running low | Less than 7 days left at the current speed of sale. | Order soon. |
| Not selling | In stock, but no sale in the chosen window. | Discount, bundle, move or return it. |
| Overstocked | More than six months of stock at the current speed. | Stop reordering for now. |
| New, no sales yet | First stocked inside the window. | Give it time. |
| Healthy | None of the above. | — |
| Never stocked | No stock has ever been recorded (shown under All items only). | — |
- Days left = stock on hand ÷ average daily sales.
- Suggested order covers 30 days of sales at the current speed, and never less than twice the reorder level, minus what you already hold. It is a starting point — adjust for delivery times and seasons.
- Batches expiring soon lists batches that expired in the last year or expire in the next 90 days and still have stock, with the quantity and its value at cost. shared code in the Left column means that batch code is used by more than one item, so the quantity can't be split between them.
Stock value here is worked out the same way as the stock value on the Dashboard and Inventory Center (the item's latest purchase cost). The Inventory Value report can differ slightly after a month-end close — see section 21.
18. Inventory Value
Reports → Inventory Value answers "what is my stock worth right now?" — at cost, and at your selling prices. There is no date range: it always describes stock as it stands today.
- Tiles: Stock value at cost and how many items are in stock; Value at selling price and the profit if everything sold at list price; Units in stock; In stock without a cost (valued at 0 until a purchase cost is recorded).
- Where the money is tied up — the ten items worth most at cost.
- Buttons: In stock (the default), No cost price, Out of stock, Negative quantity, All items.
- Columns: Quantity, Average cost, Value at cost, Share, Selling price, Value at selling price and Margin.
- Download PDF produces a printable stock valuation of the rows listed. For an end-of-month valuation, open it on the last evening of the month.
Average cost is the weighted average cost from the item's latest purchase; where no purchase is left to price stock on hand, the cost from the last month-end close is used.
19. Expense Report
Reports → Expense Report answers "where did the money go?" — by expense type, against the previous period.
- Tiles: Total expenses (the P&L's expense figure, against the previous period), the Biggest expense type, how many Expense types used, and the Daily average now and in the previous period.
- By expense type: each type's amount this period and in the previous period, the change (up is red) and its share. Click a type and its expenses are listed underneath — date, expense, description, amount, and what was paid when it was recorded — with Export these (CSV).
- Share of spending shows the same split as bars.
Amounts are the bills, whether or not they have been paid. Later payments to a vendor are on the vendor's account, not here.
20. Also under Reports
- Customer Follow Up Report — covered in the Customer Follow-Up guide, section 10.
- Inventory Center (fastest movers, low stock, the full item list) — covered in the Items & Purchases guide.
- Budgets — covered in the Expenses, Vendors & Budgets guide, section 11.
21. Why two figures disagree
| These two… | …differ because |
|---|---|
| Dashboard Cash Collections vs P&L Sales | Collections is money received (including old debts paid today); Sales is goods sold (including on credit). |
| Sales Report Total with tax vs P&L Sales | The total includes tax; P&L Sales does not. The Sales Report's first tile, Sales (after discount), is the P&L figure. |
| Sales By Item total vs P&L Sales | A discount on the whole invoice isn't shared out over items. Item Profitability shows the amount. |
| Item Profitability gross profit vs P&L net profit | Gross profit is before expenses. Item Profitability's gross profit equals the P&L's Gross profit line. |
| Receipts total vs Sales Report total | Money received vs invoices raised — the difference is credit given, less old debt collected. |
| Sales Analysis Sold on credit vs Customers Who Owe | Credit given on this period's sales vs everything still owed today, from any period, less what has been paid since. |
| Expense Report types vs its total | Expenses saved without a type are in the total but under no type (the report says how much). |
| Inventory Value vs Stock Health / Inventory Center stock value | Normally equal. After a month-end close, Inventory Value can use the close's cost for items with no purchase left to price them. |
| Web figures vs the Android app | A phone or till that hasn't synced yet hasn't sent its sales. Sync, then compare. |
| Today vs yesterday's view of the same month | Back-dated sales, purchases or expenses were entered since. Every report reflects entries by the date on them, not the day they were typed. |
22. A month-end routine
Twenty minutes on the first working day of the month, for Kenneth's hardware shop.
- Make sure everything is in. Every phone and till has synced; last month's receipts, expenses and deliveries are entered with the right dates.
- Profit and Loss → Last month. Read the statement against the previous month; export it. This is the month's result.
- Sales Analysis → Last month. Which payment types, tills and cashiers moved? Any change in the busy hours?
- Item Profitability → Last month. Clear anything under Losing money and No cost price; note the top earners.
- Stock Health → Needs action. Order the top earners first; plan to clear Not selling stock; check Batches expiring soon.
- Inventory Value → Download PDF. The closing stock value (best done on the evening of the last day).
- Expense Report → Last month. Anything up sharply? Click the type to see why. Give untyped expenses a type.
- Tax Report → Last month → the By month row for the VAT return.
- Customers Who Owe → Over 90 days → schedule calls. What You Owe Vendors → plan payments.
- Budgets → View Sales Budget and View Expense Budget. Were you on target?
23. Quick reference
| I want to know… | Open |
|---|---|
| How much money came in today | Dashboard → Today's Cash Collections, or Reports → Receipts → Today |
| Whether we made a profit this month | Dashboard P&L cards, or Reports → Profit and Loss |
| How this year went, month by month | Reports → Profit and Loss → This year |
| Whether sales are up or down, and why | Reports → Sales Analysis |
| Our busiest hours | Reports → Sales Analysis → Busy hours |
| How much each cashier or till sold | Reports → Sales Analysis → By cashier / By till |
| Which invoices are still unpaid | Reports → Sales Report → Unpaid |
| Who owes us, and for how long | Reports → Customers Who Owe |
| Which suppliers we've kept waiting | Reports → What You Owe Vendors |
| Which products make the money | Reports → Item Profitability → Biggest earners |
| Which products lose money | Reports → Item Profitability → Losing money |
| Which products are selling more, or stopped selling | Reports → Sales By Item |
| What to reorder, and how much | Reports → Stock Health → Needs action |
| What isn't selling | Reports → Stock Health → Not selling |
| What is about to expire | Reports → Stock Health → Batches expiring soon |
| What my stock is worth | Reports → Inventory Value |
| Where the money goes | Reports → Expense Report |
| A receipt to resend | Reports → Receipts → View → WhatsApp / Export PDF |
| Tax collected for VAT | Reports → Tax Report → By month |
| A branch's or department's result | Reports → Transaction Class Report |
| How we did against target | Dashboard → Budget, or Settings → Budgets |
If something looks wrong
- Today's sales look too low. Sales from phones or tills may not have synced yet. Sync them, then refresh.
- Profit looks too good. Items sold with no recorded cost — Item Profitability → No cost price lists them.
- Profit looks too low one month. A large expense (a year's rent, say) dated in that month — Profit and Loss → Where the expenses went.
- Cost of Sales is 0 but I sold products. Those items have no purchase cost on record.
- Inventory value is enormous or negative. One item has a mis-keyed purchase or negative stock — sort by Value at cost, or filter Negative quantity.
- Cash Collections is empty but we sold today. All of today's sales were on credit, or none have been entered yet.
- Busy hours is empty. All the period's sales were entered on the website, which saves the date only.
- A report says it could not be loaded. Refresh; if it persists, tell support which report and dates (section 1.6).
- A report won't export. Your usage allowance may be exhausted — My Usage shows the balance.